


Article last updated 25 November 2025.
Long gone are the days when UK equities made up the majority of the average UK wealth management portfolio. We see that as a good thing in general, given our firm belief that a global mindset is important for delivering superior risk-adjusted returns. Still, the cavernous gap between the valuation of UK companies and their peers overseas is worth investigating.
For a long time now, UK stocks have been cheap compared to international peers, and three arguments are generally given for why they are — a preponderance of ‘old-economy’ sectors and a lack of quality growth stocks, structural weaknesses in the domestic investor base and a shift away from UK listings. But we don’t think these arguments hold up under closer inspection.
Cheap for a reason, or good value?
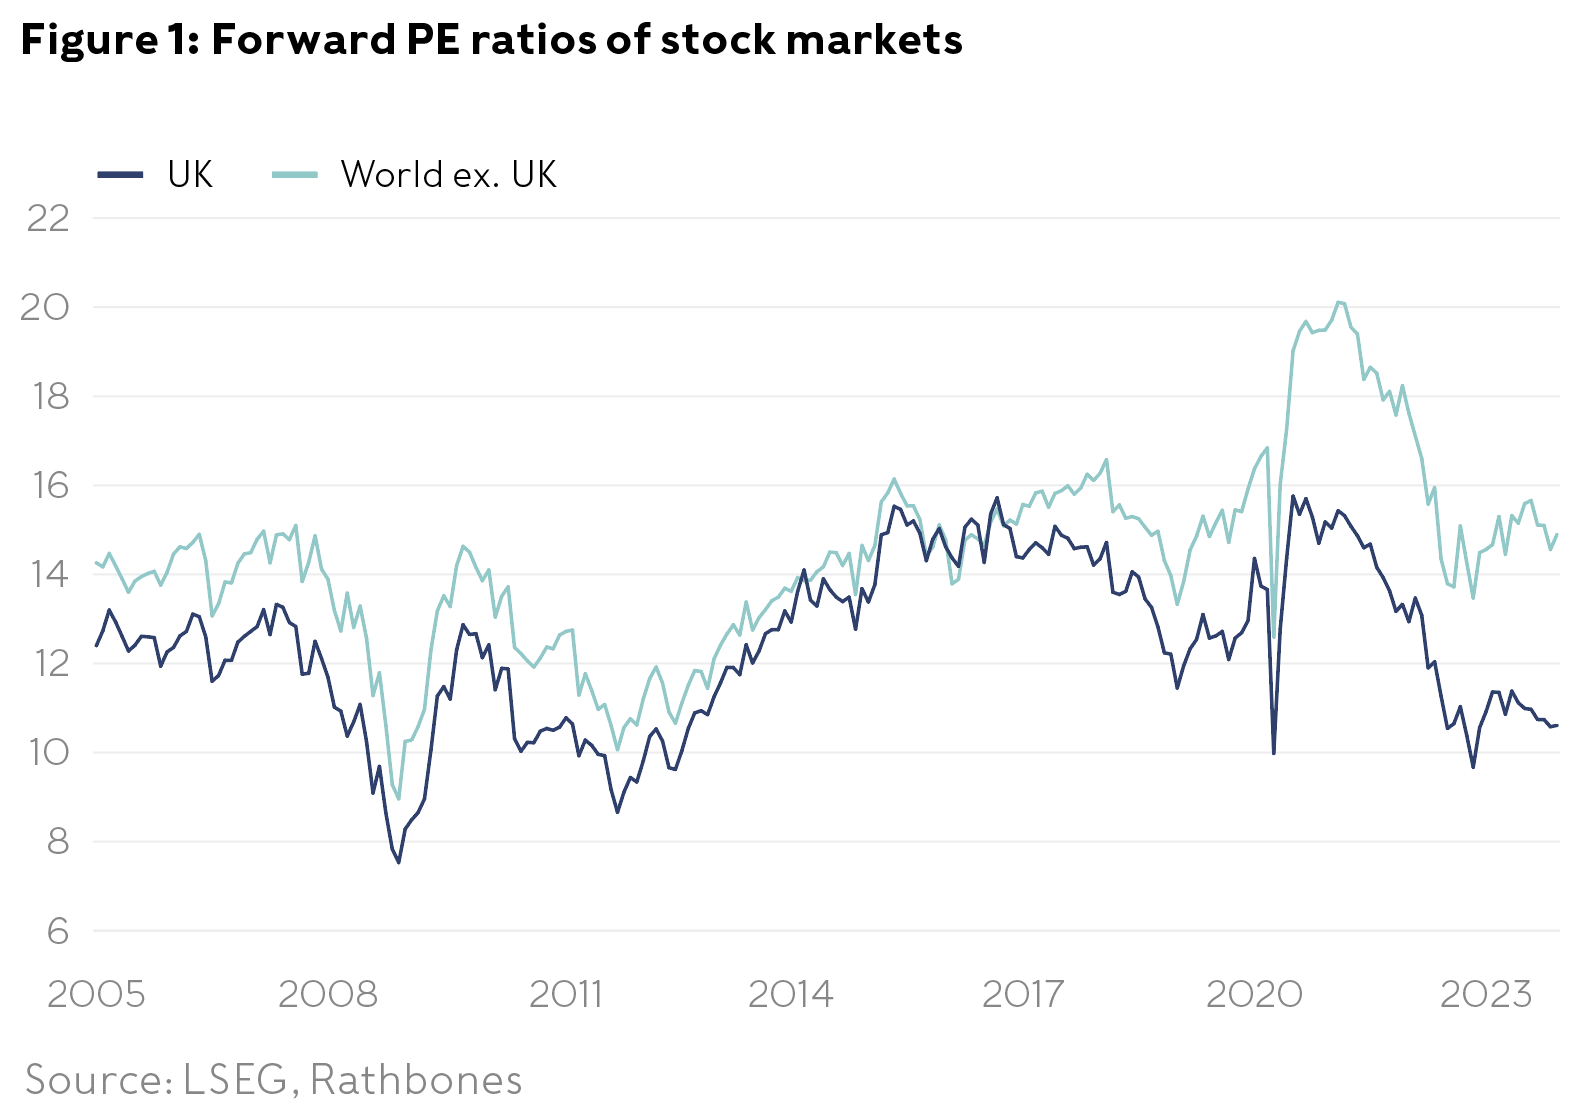
The most common measure of valuing a company is to look at prices relative to earnings (the price/earnings ratio, or ‘PE’) — often predicted profits for the year ahead (the ‘forward’ PE). The UK stock market has had lower PEs than most other major markets for a long time, and has fallen further behind them recently — particularly when compared with the US. Figure 1 shows the scale of the gap. Some investors say that’s because it’s weighted towards old-economy sectors and has fewer fast-growing, high-quality firms than the US in particular, so it makes sense that UK equities command lower valuations. Think mining companies engaged in the ancient business of getting resources out of the ground rather than tech companies changing the world.
There’s an element of truth to that view. The UK clearly has no direct equivalent to the US tech giants. But what that doesn’t tell us is how much of the valuation gap is due to the composition of the UK market, and how much (if any) is a genuine discount. In other words, are UK industrial companies, or those tech companies we do have, cheaper than US companies in the same sector, judged by the PE ratio? Understanding this distinction is key to working out whether UK equities are cheap for a reason, or truly good value.
To do this, we need to do some number crunching. Through a technique called regression analysis we can compare valuations on an apples-to-apples basis rather than the apples-to-oranges approach of figure 1. We’ve done that for a pool of more than 1,000 global stocks — 140 of them listed in the UK.
|
|
Still cheap when all else is held equal
Within this group, the average UK stock’s forward PE ratio is 16% lower than for the average stock listed elsewhere in Europe. For US stocks, that gap rises to 32%. (See the left-hand set of bars in Figure 2.) If we adjust for the fact that different sectors are larger or smaller in the three markets we compare, the gap narrows only marginally — to 28% versus the US. So UK stocks clearly trade at a discount to their US counterparts in the same sector. (See the middle bars in figure 2).
|
|
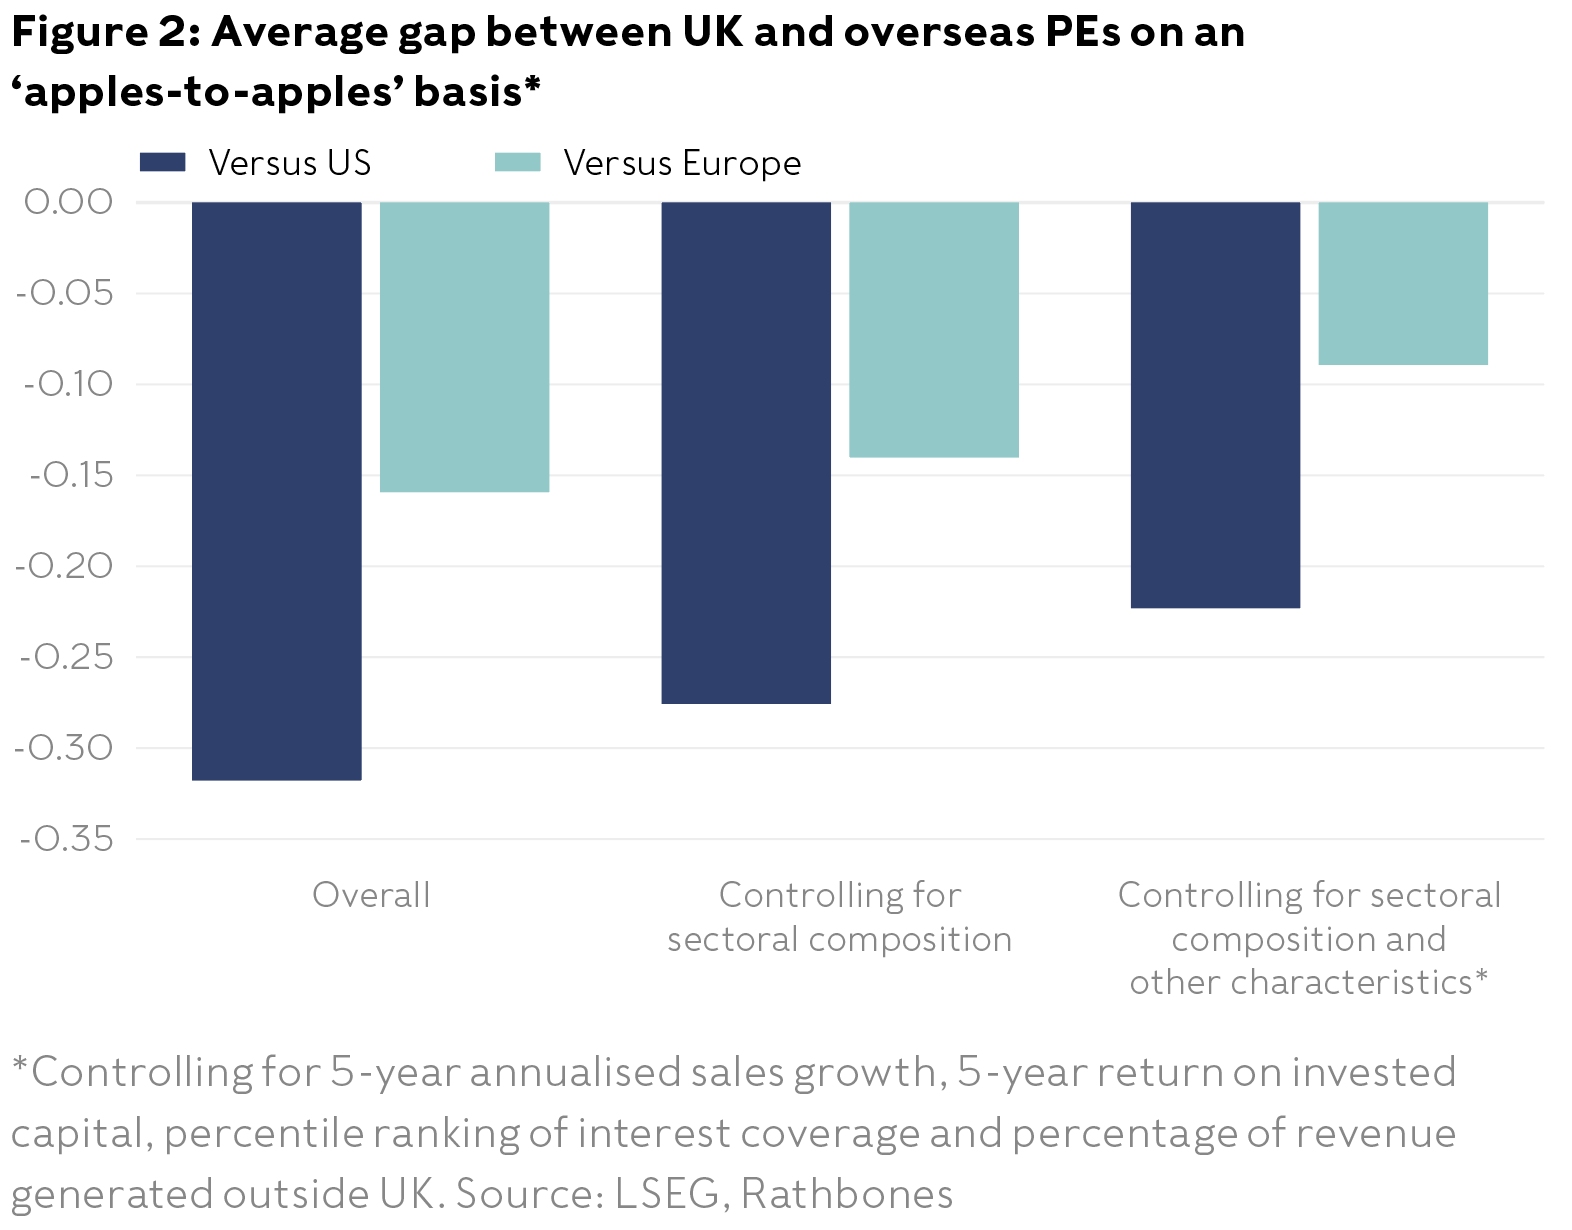
We also compare valuations based on various other characteristics. These include characteristics that suggest companies have strong growth prospects, such as sales growth. It also includes indications of a high-quality company, such as profitability and interest coverage, a measure of how easily a company can pay its debt. In each case, firms with higher scores for these characteristics have higher PEs. This is exactly as you’d expect — investors are prepared to pay more for companies with greater growth and quality. Yet even after accounting for these factors, the UK discount remains large, at about 22%. (See the right-hand bars in figure 2.) This means that firms in the same sector with identical growth and quality characteristics are cheaper if they’re listed in the UK rather than the US. That’s very hard to justify.
Is it Brexit-related?
Admittedly, our analysis shows that the UK discount emerged after the 2016 Brexit referendum. We repeated the entire exercise with 2015 data and found no statistically significant UK discount relative to the US at all, mirroring the pattern of figure 1 up to the point of the referendum. The vote to leave the EU arguably increased the uncertainty about the UK’s long-term economic outlook. However, even if you’re very pessimistic about the economic consequences of Brexit, the discount we find above still doesn’t look logical. The same discount applies to multinationals as to companies that earn all of their revenue at home. Once again, that doesn’t really make sense — there’s little obvious reason why high-quality global firms should be penalised just because they’re listed in the UK. This suggests that an investment opportunity exists.
We tested our results in a couple of ways. First, we repeated the analysis with other valuation measures, namely prices relative to book value (assets minus liabilities) and prices relative to sales. From these alternative perspectives, the gap between US and UK valuations still holds. But the gap relative to European equities disappears in both cases, after adjusting for growth and quality measures. This suggests that it isn’t the UK market that’s cheaper — instead, it’s the US market that’s expensive.
Why is there a gap?
Having established that UK equities look cheap even on an apples-to-apples basis, the question is why this discount emerged in the first place. A pessimistic interpretation is that this is down to structural weakness in demand from domestic institutional investors — particularly pension funds, something which may change only very slowly.
Fortunately, there are good reasons to think this downbeat view has been overstated. It’s true that domestic pension funds (and insurers) are far less of a force in the UK equity market than they once were — a slew of legal and regulatory changes have reduced their willingness and ability to hold equities. Data from the Office for National Statistics shows that UK equities now account for a remarkably small proportion of pension funds’ and insurers’ portfolios (see figure 3).
|
|
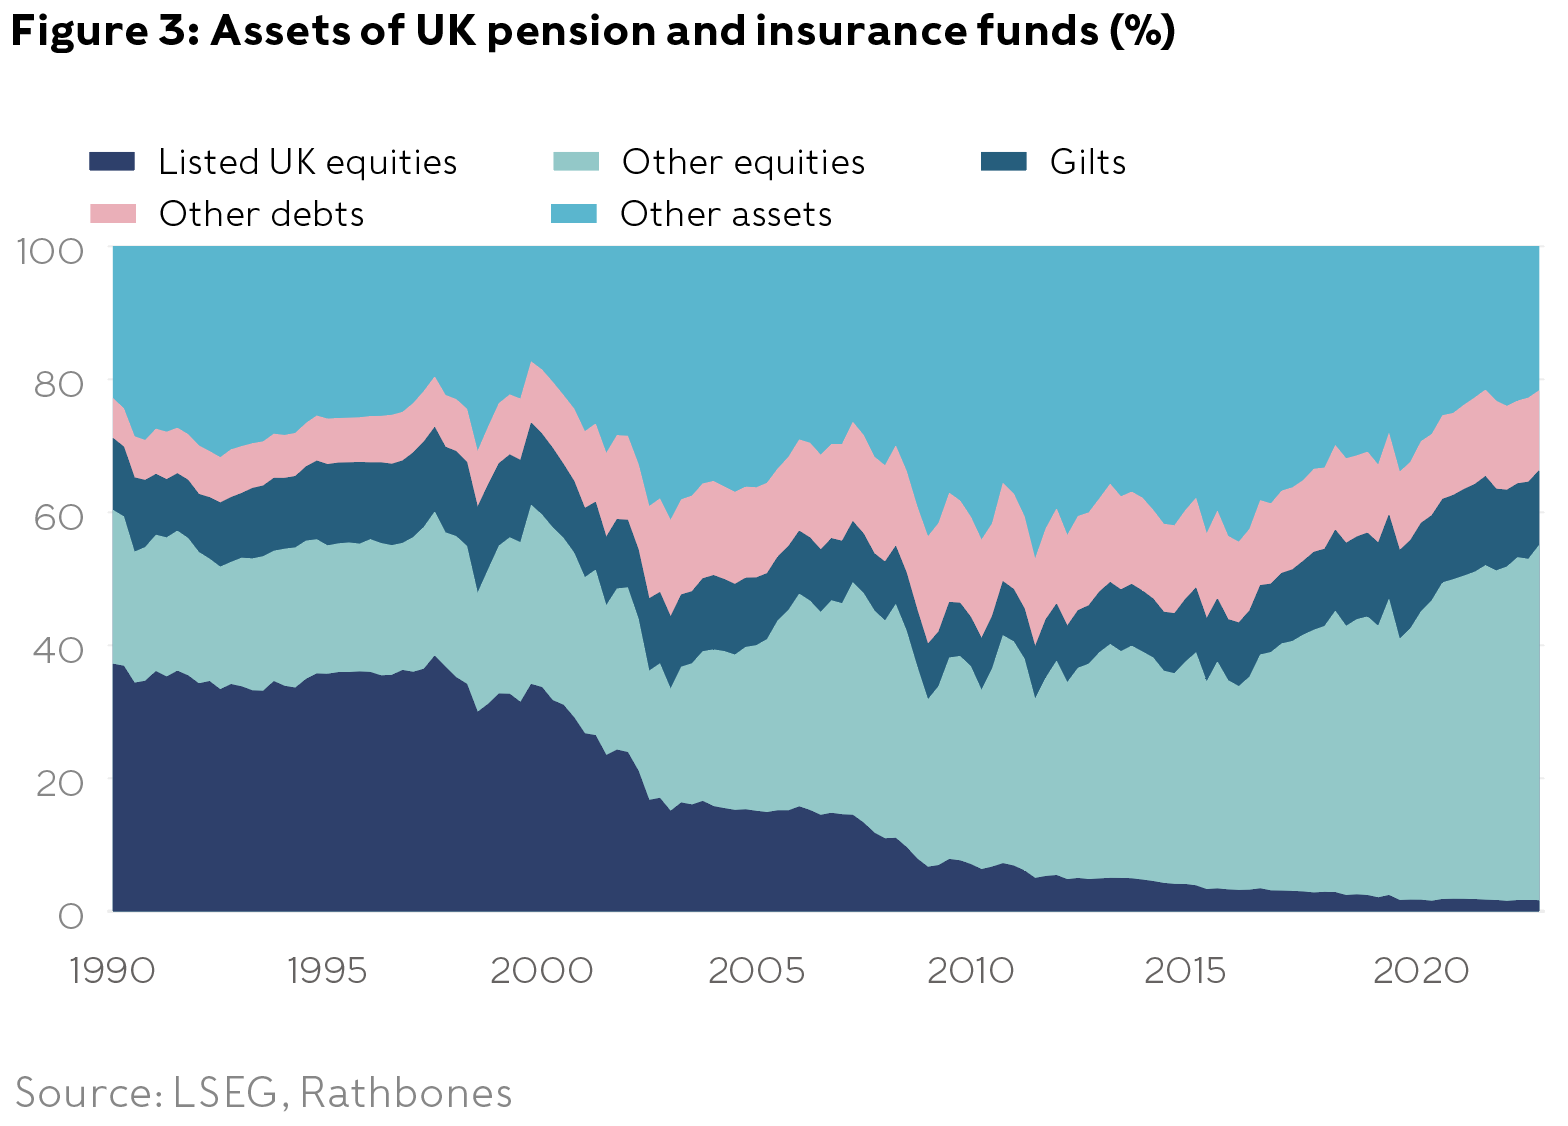
Corporate defined-benefit pension funds, which hold the majority of pension fund assets, now have more than 70% of their portfolios in bonds; before 2000 more than 70% was in stocks. Nearly all of the reduction in their equity exposure has come out of UK stocks. As a result, their share of the overall UK stock market has shrunk significantly (figure 4).
|
|
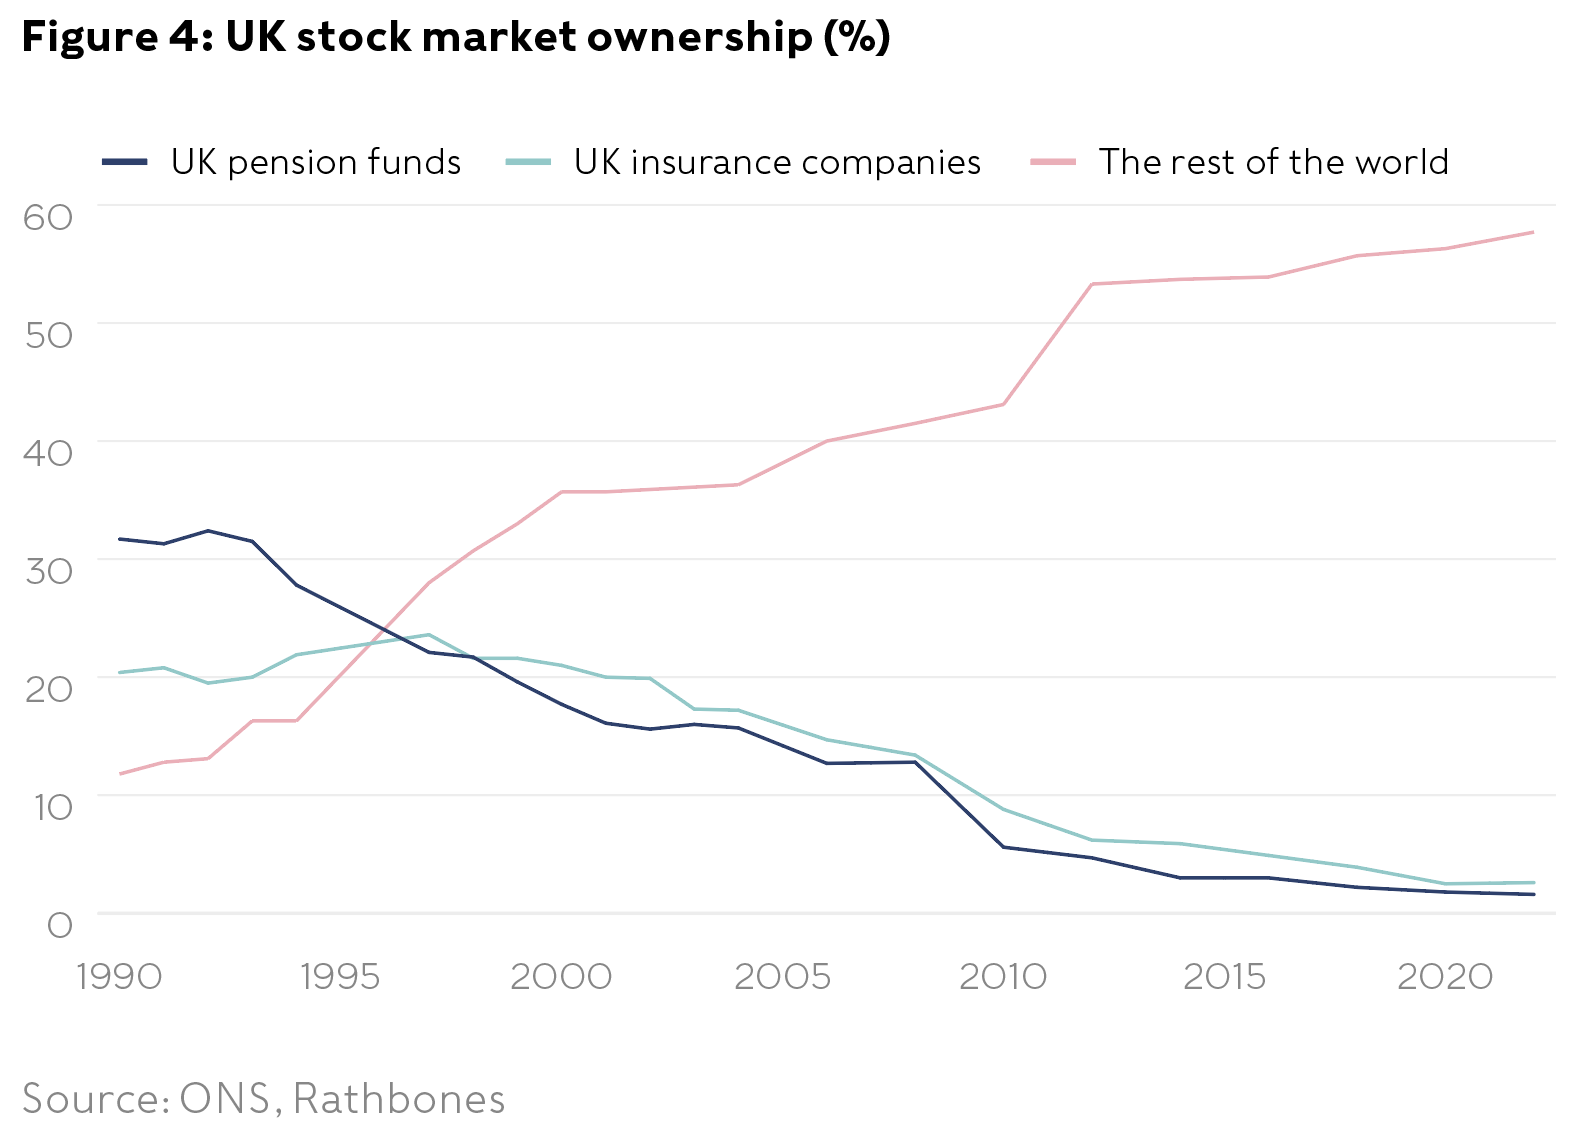
Yet it’s hard to argue that this trend is the main driver of the UK equity discount. The timing simply doesn’t work. Figures 3 and 4 both show that the progressive decline in pension funds’ share of the overall UK stock market dates back to at least the late 1990s, but the UK equity discount didn’t emerge until the late 2010s.
A more likely explanation for the UK’s valuation discount is a general pessimism toward UK equities after the Brexit vote, which triggered years of uncertainty about relations with the EU. That’s reflected in things like Bank of America’s survey of global fund managers, which shows a deterioration in sentiment towards UK stocks in the second half of the last decade.
This prompts two reasons for optimism. First, as we’ve already highlighted, investors have downgraded UK equities in a broad-brush way that doesn’t reflect where any Brexit effects are most likely to fall. The fact that global firms listed in the UK trade at the same discount as purely domestic companies suggests that mispricing exists and it might plausibly correct over time.
Second, there’s now far greater stability and political consensus around the broad outlines of the UK’s relationship with the EU than there was during the years of turmoil immediately after the vote. The UK’s formal departure from the bloc, and the subsequent transition period, have been and gone.
The 2023 Windsor Framework has further helped reduce lingering instability by making trade between Northern Ireland and the Republic of Ireland easier. The Labour Party, which has a large lead in the opinion polls ahead of the impending general election, favours a slightly closer relationship with the EU. But it accepts the most economically important parts of Brexit — the UK’s departure from the EU’s single market and from its customs union — as a fait accompli, to borrow a phrase from across the Channel. In other words, the intense uncertainty surrounding the UK’s long-term trading arrangements has eased.
Are shifting and declining listings a problem?
UK investors and policymakers have fretted recently about UK-listed firms such as CRH, Flutter and Ferguson considering or even going ahead with moving their primary listings to the US. Yet this trend — possibly a consequence of the valuation gap we’ve discussed — may actually be a good thing for holders of UK equities.
If a UK-listed company believes its stock trades at a valuation discount to its US-listed peers purely because of where it is listed, it has an incentive to move in hope of closing the gap. This logic was widely cited in the media in the case of CRH. From an investor’s point of view, it makes sense to buy a stock while that discount still exists, capturing the possible upside if a move is announced, rather than waiting to buy in the more expensive US market. CRH, for example, has outperformed its sector since it began the process of moving its primary listing. Some of the negative coverage of shifting listings is connected to the fact that they’re bad news for the London Stock Exchange, which misses out on fee income. But that’s not relevant to investors generally.
There’s a separate, but related, debate about the behaviour of firms that don’t already have a pre-existing UK listing. The highest profile example recently is Arm. When the Cambridge based tech firm chose to go public, it shunned the UK market in favour of the US. In such cases, most investors can’t capture any valuation increase from a move to the US. Beyond Arm, there have been far more IPOs in the US than the UK recently (more than 1,500 versus just 212 since the start of 2021) and the median size of US IPOs has long been much larger.
However, it doesn’t follow that a market with many IPOs is a good investment. That depends on the quality and price of the companies going public, which can vary enormously. China, for example, has seen far more IPOs than the US over the past decade, but its stock market has significantly underperformed.
A surge in IPOs may sometimes even be a sign of an inflated market, with the owners of weak companies taking advantage of high valuations to cash out. The total number of US IPOs was exceptionally high during the dotcom bubble of the late 1990s, and again during the highly speculative boom in special purpose acquisition companies (Spacs) of 2021, which ended badly. An academic study of nearly 10,000 US IPOs over more than four decades has shown that IPOs typically underperform the broader market substantially in the three years after listing. A dearth of listings may hurt the stock exchange and the advisers who are paid to facilitate such deals — but once again, their interests are not aligned with those of investors in general.
Don’t throw the baby out with the bathwater
Long gone are the days when UK equities made up most of the average UK portfolio. We firmly believe that a global mindset is important for delivering superior risk-adjusted returns. It provides us with greater diversification and a far larger set of opportunities. But there’s a risk of throwing the baby out with the bathwater.
We’re still comfortable allocating more to the UK than its tiny weight in global indices (4% in the FTSE All-World, for example). Our case for retaining a larger UK weighting isn’t based on patriotism, or even optimism about the UK economy. It’s based on our analysis showing that mispricing exists. The UK market contains global businesses that — on a level playing field, after adjusting for sector and quality and growth characteristics — appear significantly undervalued relative to international peers.