


Article last updated 24 July 2025.
Quick take:
-
Japanese stocks fell 12% on Monday as the yen soared against the dollar
-
Investor concerns about a US recession sent US bond yields and stock prices tumbling, yet the data was mixed not screamingly bad; we currently have US recession odds at 25%
-
Meanwhile, US company profits are rising at near 12%, the highest level since late 2021
-
The Bank of England has cut interest rates by a quarter percentage point to 5.0%
A seismograph for US economic tremors
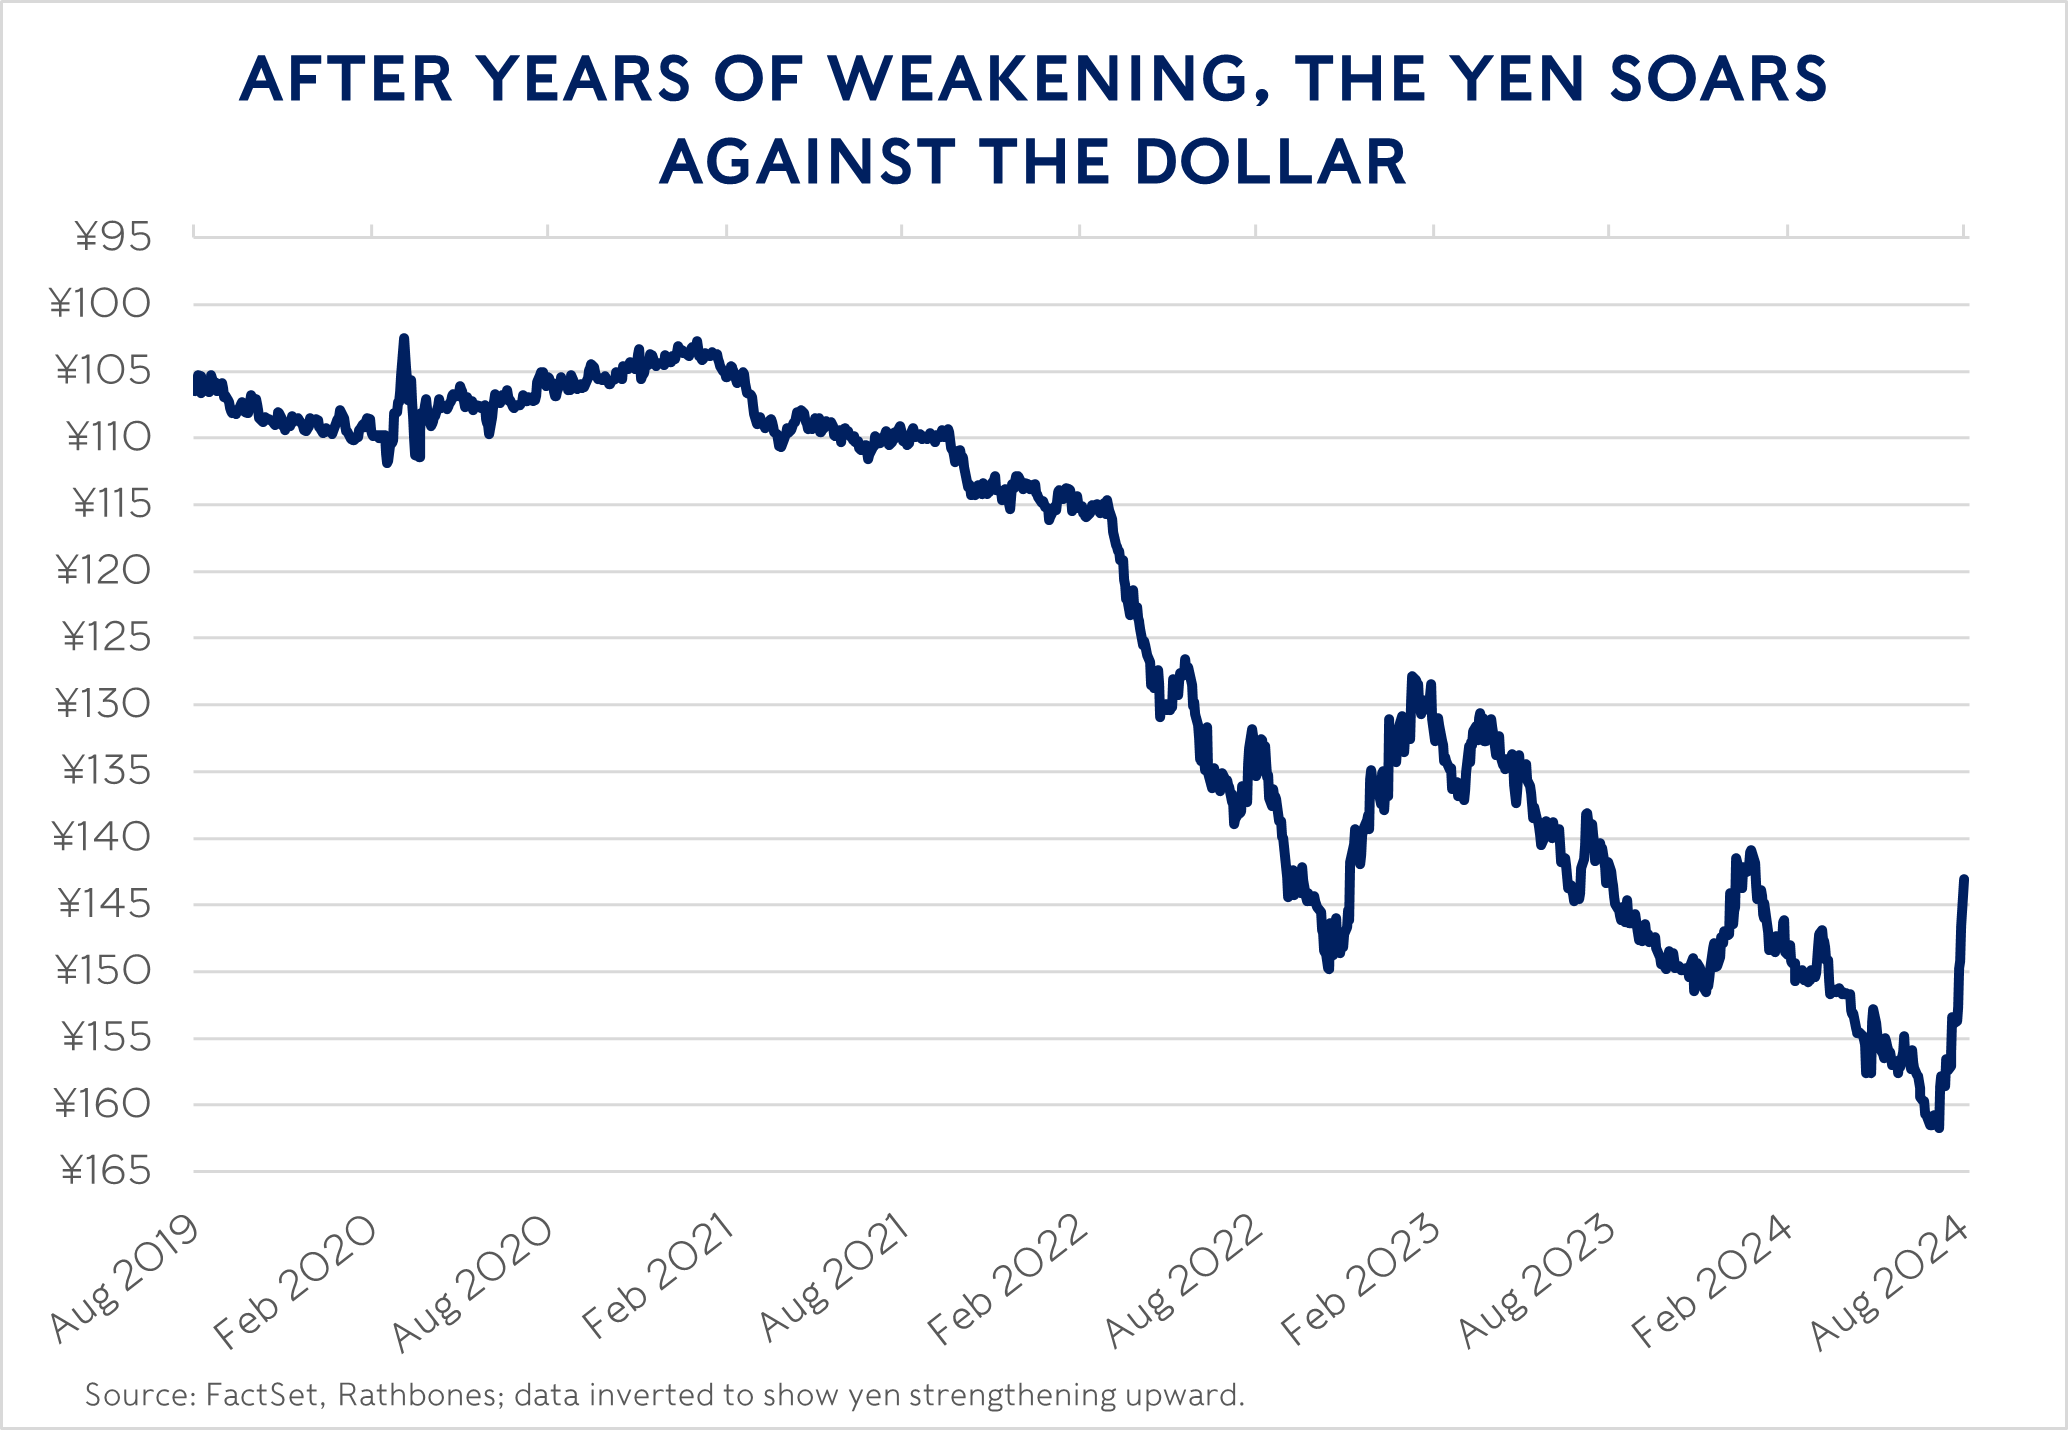
The bottom has fallen out of the Japanese stock market as the yen rockets in value against the dollar. Overnight the Nikkei index dropped 12% – its single-largest daily drop since Black Monday 1987. The index is now down more than a quarter since hitting a record high in July. That’s erased all of the Nikkei’s impressive gains since November 2023. That’s in both yen and sterling terms: in other words, the gains in the yen were not enough to offset equity market losses for UK investors. Banks and exporters were hit hardest. Like a shockwave, the effects rippled further afield to other Asian and Pacific markets, and they continued rolling outwards into European markets and futures for the US market too.
What’s caused these sudden, brutal moves? There’s a large divergence in the policies of central banks around the world. Most are reducing their interest rates or preparing to do so: a case in point is the Bank of England which narrowly voted for a quarter-percentage-point cut in its benchmark rate to 5.0% last week. However, the Bank of Japan(BoJ) is lagging behind the major Western banks because of its years-long battle to escape ‘deflation’ (where prices fall each year, rather than rise slightly). This has perhaps made Japan a sensitive seismograph for tremors in the US.
We can sometimes forget about the BoJ, but it’s tied with China for the third-largest central bank by assets behind the US Federal Reserve (Fed) and the European Central Bank. It has a lot of firepower and it has been doing a lot of intervention in virtually all its markets (stocks, currency, bonds) for years. The BoJ has spent years and tens of billions of dollars selling its own currency, the yen, and buying Japanese bonds and stocks while keeping its benchmark interest rate below zero. The aim being to encourage investment, keep Japanese borrowing costs low and weaken its currency to jumpstart inflation and economic growth. That has worked, with inflation staying above 2% each month since April 2022. Before then, the last time it got anywhere near 2% was March 2015 (and that was a rarity going back to the 1990s).
So recently the BoJ has moved to unwind this situation. Last week it raised its interest rate for the second time, taking it to around 0.25% from the previous range of 0% to 0.1%. It also outlined a plan to halve its monthly government bond purchases by 2026 to just $20 billion (£15.7bn). Initially the market reaction was relatively contained. The rate hike came earlier than expected, but it wasn’t a wildcard move. And the tapering of its asset purchases was in line with expectations. Japanese government bond yields barely moved and equity and currency volatility were contained at first. And, after the yen hit a 38-year low in early July, the BoJ had already started buying its currency aggressively to prop it up. It burned through something like $37bn in that endeavour. Since Thursday, however, Japanese markets went haywire (see chart for the currency moves).
That suggests that these moves were as much about changes in people’s perceptions of the outlook beyond Japan’s shores than about Japan per se. And influenced by the unwind of a so-called ‘carry trade’ (borrowing cheaply in yen to fund leveraged overseas asset purchases). Two pieces of American economic data added to a picture of deterioration that has been making some edgy. That led many to assume that the Fed will reduce rates much faster than forecast. So, higher-than-expected rates in Japan and lower-than-expected in the US boosted the divergence in monetary policy.
We don’t believe anyone can make short-term currency forecasts with the accuracy required to influence our tactical asset allocation – the academic literature agrees with us. But there’s plenty of evidence that, over the long term, currencies do move with economic fundamentals. By this we mean they rise and fall in line with how their prices, productivity, and outlook for savings shift when compared against other nations’ metrics). The backdrop to all this is that the yen had fallen extraordinarily far below what the economic fundamentals would imply versus the dollar, and had even become cheap versus the long-beleaguered pound. It’s impossible to use these fundamentals to time trades, but they act like a set of bellows when the short-term signals shift.
Is the US economic landscape shifting?
The first tremor in the US last week was the ISM Manufacturing PMI, which gauges the strength of factories. It fell 1.7 points to 46.8 for July. It had been expected to creep slightly higher toward the 50 level that is a rough divide above which industry is believed to be growing and below which it’s assumed to be shrinking. While disappointing, the indicator has bounced around this sort of level for more than a year now without issue. However, what really spooked investors was a sharp 5.9-point fall in the employment sub-measure to 43. That’s historically consistent with recession.
The second wobble was the estimated number of US jobs added in July coming in much lower than expected, while the unemployment rate rose from 4.1% to 4.3%. Rising unemployment is generally consistent with recession as well, so many investors responded by buying US government bonds (which tend to hold up well in a downturn) and selling stocks (which drop during a slowdown). In particular stocks that are more cyclically sensitive, i.e. which tend to rise and fall with the ISM survey, have underperformed markedly. All these moves implied that investors expected more rate cuts from the Fed than originally pencilled in. Some commentators started calling for a half-percentage-point cut in September, more than double what was broadly expected before the drama.
Now, as highlighted in our video recorded early last week, while the risk of recession this year is there, we had put it at 25% even before last week’s data. Although, we are now reviewing that estimate to determine whether it has changed. It’s important to breathe and remember that this is just one month of figures. The ISM Manufacturing PMI is often more volatile than the wider business cycle, and, since COVID-19, survey-based measures haven’t been the brilliant leading indicators of activity that they had been in prior decades. These measures could well have been affected by Hurricane Beryl which hit the southern US last month, causing roughly $32bn of damage and leaving many temporarily unemployed.
Some of the increase in unemployment is due to surging labour supply and immigration. Adjusting ‘recession-rule’ indicators to look at only those people who have lost jobs or ended temporary contracts without finding a new one finds amber flags rather than red ones. We cut the numbers this way as they shouldn’t be impacted by labour supply surges in the way that the number of unemployed could be.
That being said, we have long flagged that weakening employment would be a key risk to the US economy and markets. The number of state unemployment rates that have triggered ‘recession rule’ indicators has been unusual. Many of the indicators that have given us confidence of normalising wage inflation, historically, have also tended to point to weak employment. Since last year, payrolls data has been revised down fairly consistently and we’ve noted that – excluding the Bureau of Labor Statistics spurious firm ‘birth/death’ adjustment (a guess at how many newly created firms aren’t being surveyed) and the non-cyclical healthcare and education sectors – US payroll growth has already turned negative. This has been a red flag in the past.
These concerns about recession meant a tough few weeks for US stock prices continued even as the companies themselves actually delivered pretty good profit growth at the same time. About three-quarters of S&P 500 businesses have reported their second-quarter results, averaging 11.5% profit growth – the highest since Q4 2021. And the performance was broadly spread across most industries. However, the exceptions were energy, industrials and commodity businesses, all of which are heavily sensitive to the wider economy.
The tech-heavy Nasdaq Composite stock market index fell 3% last week and is 10% lower than its most recent high. The more diversified S&P 500 index was down just 2% last week and 6% off its most recent high.
With stock valuations higher than normal and companies and investors cagey about the future, nervousness is rife. This caused an earthquake today, but how significant it will be in the fullness of time will depend on the number and severity of the aftershocks. We will keep you posted with level-headed analysis.
If you have any questions or comments, or if there’s anything you would like to see covered here, please get in touch by emailing review@rathbones.com. We’d love to hear from you.